Constructing height-time maps to track CMEs
This is a PUNCH Science Nugget
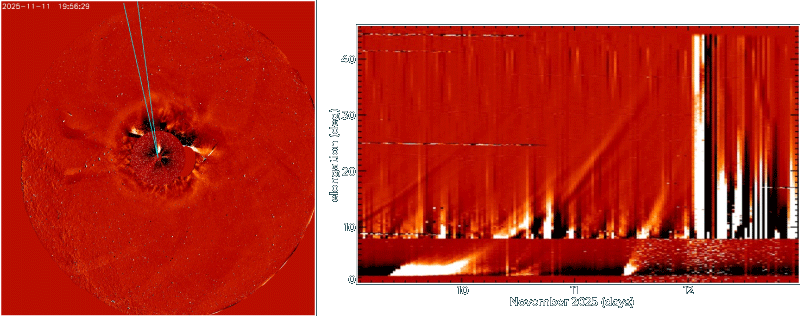
Left: PUNCH Wide-Field Imager (WFI) difference image with embedded SOHO LASCO C3 coronagraph image showing a coronal mass ejection (CME) in November 2025 overlaid with a 5° (position angle) radial wedge (blue lines). Right: Height (elongation-angle, ε)-time intensity plot constructed by stacking consecutive images of that radial wedge from left to right. Note the particle storm in C3 (ε < 8°) and saturated WFI data (ε > 8°) on Nov. 12, possibly caused by geostorm aurora.
PUNCH produces composite white light images of half the sky, centered on the Sun, every ~30 min. PUNCH Scientists (T. Kuchar & D. Webb) use consecutive images over a period of hours to days to track Coronal Mass Ejections (CMEs) and other transient outflows, using height-time maps.
We first make "difference images" by subtracting a previous image from each time step, minimizing background elements such as stars, and enhancing outward motions, such as CME fronts.
We make height-time maps by stacking (from left to right) a radial wedge from consecutive difference images containing a CME1,2. The wedge is centered on a given position angle (PA) measured 0-360º CCW around the Sun, e.g., PA=10° (see Figure) and averaged across the width of the wedge (to enhance the signal-to-noise; here wedge width=5º). The result is solar brightness plotted on a height-time plot as in the Figure (right panel), where height is "elongation" or angular distance from the Sun, ε. If the image has missing or bad data, we use a blank line to maintain the cadence of the measurements.
The inclined tracks in the right panel show the velocity and direction of outward-propagating transients. The geometrical shapes of these tracks depend on the propagation characteristics of the transient. For example, the shape may indicate acceleration of the CME or (for large ε and assuming constant velocity) whether the CME front lies within the plane of the sky (straight line), or is directed Earthward (curves upward), or is directed anti-Earthward (curves downward). In addition, such plots can be used to track Stream Interaction Regions (SIRs)3, which can appear as converging tracks.
References
1 Sheeley et al., Astrophys. J., 675, 853 (2008). N/A
2 Davies et al., Geophys. Res. Lett., 36, L02102 (2009). Doi: 10.1029/2008GL036182
3 Rouillard et al., Geophys. Res. Lett., 35, L10110 (2008). Doi: 10.1029/2008GL033767
PUNCH science nuggets are archived on our News Page.
You can subscribe to PUNCH nuggets by email.
NASA official releases about PUNCH are at the NASA PUNCH blog.