What Is
Heliophysics?
 What is the solar wind?
What is solar wind turbulence?
What is the Alfvén Zone?
What are CMEs?
What are CIRs?
What are shocks?
What is the solar wind?
What is solar wind turbulence?
What is the Alfvén Zone?
What are CMEs?
What are CIRs?
What are shocks?
Click the image labels above or the expanding titles below to see more about each science topic.
Heliophysics is the exploration of our star, the Sun, and how it influences Earth, space, and planets throughout the Solar System. Heliophysics research helps protect astronauts, spacecraft, and power grids here on Earth.
PUNCH scientists are heliophysicists who research the fundamental physics of the Sun and how it releases charged particles, magnetic fields, and solar storms that affect conditions (space weather) in interplanetary space. These phenomena can be divided into Ambient and Dynamic features of the space between Earth and Sun.
Click on a section title below to open, or | .
Ambient Solar Wind
The PUNCH mission will make unprecedented global measurements of the faster and slower streams of the solar wind. The solar wind is a million-mile-per-hour stream of charged particles (electrons and ions) emanating from the outer atmosphere of the Sun in all directions.

In this artist’s concept, the solar wind — a stream of electrically charged particles, represented in gold — is deflected by Earth's magnetic "shield". Earth is in the middle of the image, surrounded by its global magnetic field, represented by purple lines. The blue crescent on the right represents the bow shock where the solar wind flow of charged particles is abruptly turned by Earth's magnetic field.
Image credit: © Walt Feimer (HTSI)/NASA/Goddard Space Flight Center Conceptual Image Lab
The solar wind pervades interplanetary space and beyond. Its presence defines the heliosphere – the region of space influenced by the Sun. PUNCH observations are focused on the inner heliosphere between the Sun and Earth orbit. This is the domain of the young solar wind where the sun's outer atmosphere, the corona, transitions to a dynamic flow. The grander heliosphere extends out more than twice as far as the orbit of Pluto until the solar wind is slowed by its encounter with interstellar space at the heliopause.

In this illustration, the little yellow dot at the center of the image, with horizontal rings around it, represents the Sun and the planets of our solar system. NASA's Voyager 1 and Voyager 2 probes are depicted outside of the heliosphere, a protective bubble created by the Sun that extends well past the orbit of Pluto. In August 2012, Voyager 1 crossed the heliopause, the zone where the solar wind interacts with the interstellar wind. Heading in a different direction, Voyager 2 crossed another part of the heliopause in November 2018.
Image credit: NASA/JPL-Caltech
The solar wind reveals its presence to the naked eye when it interacts with comets, forming long tails as they pass nearer to the Sun. Auroras occur in the polar regions of Earth when the solar wind’s charged particles interact with Earth’s magnetic field and uppermost atmosphere. This interaction provides the atoms in Earth’s atmosphere with extra energy, which is released as bursts of light.

Comet NEOWISE is at the lower right of this photograph made on July 14, 2020 by Donna Lach - an avid participant in the Aurorasaurus project. The comet is seen against the backdrop of a green aurora visible in western Manitoba, Canada. The long streak of light at the top is a meteor. The purple, ribbon-like structure is an aurora-like structure called STEVE (short for Strong Thermal Emission Velocity Enhancement), a phenomenon that was recently discovered with help from citizen scientists like Ms. Lach. You can also participate! (NASA, Earth Observatory)
Image credit: Donna Lach and NASA
PUNCH will study turbulence in the million mile-per-hour outflow of magnetized plasma from the Sun called the . Turbulence is a near-universal process that moves energy from large scales to small scales in nearly all liquids and gases. Any change in the speed or direction of a flow results in turbulence.
Everyday examples of turbulent flow are the wake of a motorboat in a river, or the swirls and eddies caused by rocks in a flowing stream, or the tumbling of air over a mountaintop, or the billowing of smoke from a wildfire. Even the blood in our arteries is considered a turbulent flow due to friction that slows the flow of blood near to the artery walls compared to the faster flow at the center. Turbulence can occur for all states of matter that flow, including the plasma of the solar wind.

An artist’s rendering of the solar wind – a turbulent outflow of solar material from the Sun that is always passing by Earth. Click on image to view animation.
Image credit: NASA Goddard's Conceptual Image Lab/Greg Shirah

Analysis of Vincent van Gogh’s paintings, such as the famous Starry Night, reveals that the whirling patterns in many of his paintings are mathematically similar to patterns seen in real turbulence like swirling water, air from a jet engine, or the plasma of the solar wind.
Image credit: Google Art Project. Painting in collection of Museum of Modern Art, New York
The time-lapse movie of the solar wind flow (left, below) is a result of the NASA STEREO mission. It reveals the nature of the transition from the Sun’s outer corona to interplanetary space -- where the Sun’s magnetic field has less influence on the plasma’s outward motion. Smoother flow of plasma at the right of the image (nearer to the Sun) takes on a clumpy appearance as the flow proceeds to the left of the image (farther from the Sun). The clumpiness may be due to unstable conditions that cause turbulence and break up the flow, just as the stream from a squirt gun becomes unstable and breaks into blobs of water (right, below) (See a slow-motion music video (YouTube) of this process).


The transition in the structure of the plasma flow occurs in the outermost corona (more than 20x the Sun’s width from the star itself). It is not yet well understood but may be related to the formation of turbulence. PUNCH will image this region with 10x sharper resolution and with 30x more sensitivity than STEREO could, to reveal whether the transition is due to turbulence in the solar wind flow.

The slower streams of the solar wind near Earth are dominated by fluctuations of unknown origin. Are these fluctuations just preserved puffs of wind from intermittent sources on the Sun itself, like miniature ? Or are these features turbulent gusts that develop in the flow itself as it travels from the Sun to Earth, like the clumpy flow from a terrestrial squirt gun? PUNCH scientists will be able to see the source and evolution of these near-Earth features and thus learn to what degree both phenomena may be occurring.
Data from the four PUNCH cameras in Earth orbit will combine to provide images with enough detail to track the small features and fluctuations of the solar wind throughout the inner heliosphere – from the outer corona of the Sun all the way to Earth orbit. This allows a more global, continuous picture of how the highly structured corona becomes the turbulent, disordered solar wind.
A major objective of the PUNCH mission is to understand the unique physics of the Alfvén Zone – a relatively unexplored region in the outermost atmosphere of the Sun where the is first released into interplanetary space.

The Alfvén Zone was named for Hannes Alfvén – a Swedish electrical engineer (1908-1995) -- who predicted a class of plasma waves now known as Alfvén waves. He received the 1970 Nobel Prize in Physics for this theoretical discovery.
Plasmas are electrified gases and considered the fourth state of matter along with solids, liquids, and gases. More than 99% of the matter in the universe is made up of plasma.
Alfven made many other contributions to plasma physics, including insights about comets tails and aurorae.
Image is public domain.
Alfvén waves pervade the solar corona and are important to understanding the physical meaning of the Alfvén Zone.

Alfvén waves form and propagate along magnetic field lines in the coronal plasma as naturally as vibrations propagate along a plucked guitar string (link to YouTube video).
Hannes Alfvén had music in his family. His uncle, Hugo Alfvén (1872–1960), composed the renowned Swedish Rhapsody: Midsommarvaka (Swedish for Midsummer Vigil).
Image credit: Plectone
Alfvén waves in the solar corona allow a disturbance in one region of the corona to be “felt” or “communicated” to the corona as a whole.
The speed of Alfvén waves depends on the strength of the magnetic field and other qualities of plasma environment. These waves are traveling within the coronal plasma that is itself flowing away from Sun at higher and higher speeds as it gets farther and farther from the Sun.
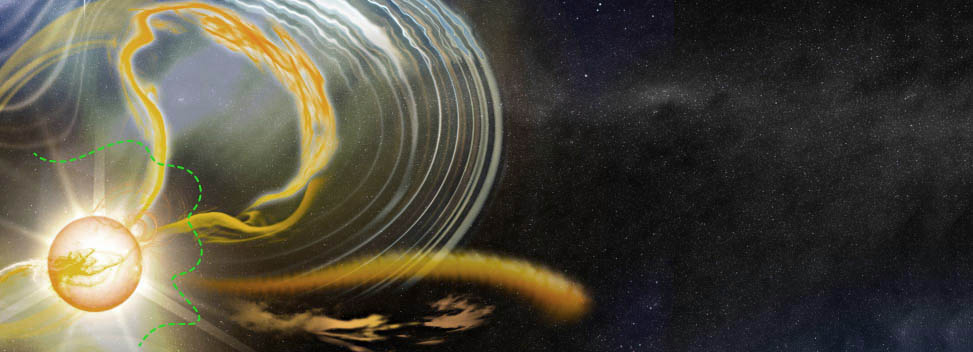
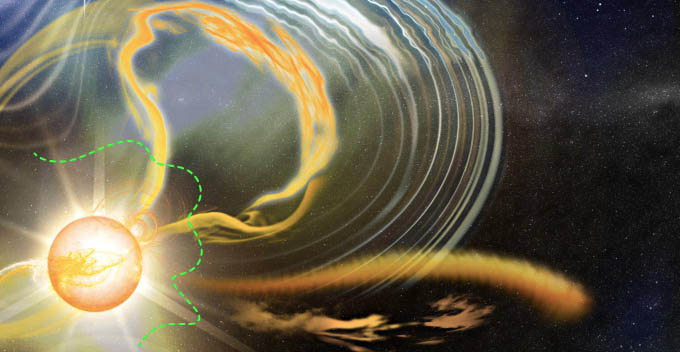
There comes a point when the speed of the outbound flow exceeds the speed of Alfvén waves propagating inward. When this happens, the Alfvén waves are swept outward by the flow before there is time for them to propagate inward, and the outflowing plasma emerges freely into interplanetary space. The released solar plasma (the ) can no longer affect the corona directly.

This time-lapse, colorized movie reveals the “riotous torrent” as the corona expands into outer space and becomes the solar wind. It includes regions where the Alfvén zone may be present. The movie has been processed to highlight fluctuations in the brightness of the corona over a period of three days. Green features are brighter than average, and violet features are slightly fainter than average. Each coronal feature is moving outward at 50 to 200 miles per second.
Image credit: DeForest et al. 2018
The Alfvén Zone in not a fixed “layer” of the solar atmosphere. Computer simulations predict that it occurs over a large and variable range of altitudes where the rapidly outflowing plasma in the solar corona gradually disconnects from the Sun and becomes the young solar wind that is released into interplanetary space.
This transition is not marked by any particular local change in the plasma, but marks a global change in the plasma's relationship to the Sun. Outside the transition, the plasma is fully disconnected from the star and no longer part of the solar corona.
Because it is hard to detect, the Alfven Zone is perhaps the least-studied portion of the Sun’s corona to date. PUNCH will provide the first global maps of this zone and how it moves and changes. These observational data will help to refine the computer models with real data.

Computer simulations of the corona show the center of the Alfvén zone as a smooth surface in three dimensions. As can be seen in the magenta, pansy-shaped outlines of the computer graphics above, the height of this “final frontier” of the corona varies by up to a factor of 10.
Image credit: Cohen, 2015
Dynamic Solar Wind
Coronal Mass Ejections (CMEs) are massive bursts of charged particles and magnetic field from the Sun’s outer atmosphere (the corona) into interplanetary space. PUNCH will be observing near a peak in the Sun's 11-year activity cycle when such solar storms are more likely to occur. Like no spacecraft before it, PUNCH will be able to image and track each visible CME as it travels outward from the solar corona all the way to Earth orbit.

In a typical CME event, billions of tons (up to 1013 kg) of solar plasma are ejected at more than a million miles per hour (300-1000 km/sec), resulting in a “solar storm” – a magnetized cloud of material racing through the heliosphere. This video provides an example of a Coronal Mass Ejection visible to the NASA STEREO spacecraft.

In addition to CMEs, the other type of “storm” is a solar flare, which releases magnetic energy low in the corona. A CME can be triggered by a flare, but there need not be a flare for a CME to occur. This beautiful music video describes the difference between the two major types of solar explosions that affect the space weather in interplanetary space.
Solar storms from CMEs are primary features of space weather that can have both dangerous and beautiful consequences when released in the direction of Earth. A CME’s charged particle radiation can harm spacecraft and astronauts in its path. A CME’s impact on our planet’s magnetic “shield” can cause auroral lights to dance more vigorously and glow more brilliantly, even at lower latitudes. Sometimes the impact may be severe enough to induce destructive currents in ground-based power stations and pipelines.

The image above is an artist’s depiction of a solar storm heading toward Earth’s magnetosphere. Sizes are not to scale. If the Sun were represented by the size of a large grapefruit, the Earth (the ball inside the purple shielded region) would be the size of a pencil tip 50 feet (15 meters) away from the grapefruit.
Image credit: NASA

It is important to track and predict the behavior of powerful storms, whether they be destructive winds in Earth’s atmosphere or a CME’s violent blast of charged particle radiation in our space environment. Like no spacecraft before it, PUNCH will be able to track each visible CME as it travels outward from the solar corona all the way to Earth orbit. PUNCH will make 3D imagery of the finer details of CMEs and study how their structure changes, evolves, and interacts with other features in the solar wind.
Image credit: NOAA

PUNCH science is aimed toward sparking a “weather satellite revolution” akin to when humanity first began to track terrestrial storms using down-looking satellites in Earth orbit. PUNCH scientists are hoping to bring a kindred revolution to the prediction of space weather starting with a constellation of four Earth orbiting satellites to image the space between Sun and Earth.
Image credit: NASA

Solar storms like CMEs occur more frequently during the peaks of solar activity that occur about every 11 years. This montage shows images of the Sun during one solar cycle. Solar maximum occurred during 2001 while solar minima occured in 1996 and 2006. The PUNCH mission will be observing during a period of solar maximum when there may be as many as three CMEs per day. The potential for new discovery is enormous!
Image credit: NASA

According to an article on the High Altitude Observatory’s website, this hand drawing of the solar corona made by European astronomer G. Tempel of the 18 July 1860 total solar eclipse was among the first observations ever recorded of a CME. The Sun was at a peak of its 11-year activity cycle making it more likely that a CME could erupt during the few minutes of totality.
Image credit: G. Tempel

Instead of 1860 being the first recorded CME, it is possible that this Ancestral Puebloan rock art in northwestern New Mexico is the first evidence of a human having witnessed a CME. According to a Smithsonian article this distinctive petroglyph, located in Chaco Culture National Historical Park, may depict the 11 July 1097 total solar eclipse during a period of peak solar activity. Independent analyses suggest a solar maximum in 1098.
Image credit: GB Cornucopia, Chaco Culture National Historical Park
The PUNCH mission will be observing the solar corona during a maximum of the solar activity cycle predicted between 2023 and 2026.
A total solar eclipse of the Sun was visible from the US on 8 April 2024
During totality in 2024, we can watch for a solar storm disrupting the solar corona in the manner that the observers of 1097 and 1860 may have witnessed.
PUNCH will provide the first routine imagery of the shape and evolution of the heliopshere’s enigmatic Co-rotating Interaction Regions (CIRs – See Eye Ars). CIRs are long-lasting, large-scale regions of interplanetary space that have enhanced density and magnetic field strength. They are “co-rotating” because, unlike Coronal Mass Ejections (CMEs or ), CIRs sweep around the Sun with the Sun’s rotation (link to YouTube). A CIR typically recurs once every 28 days – the time for the lower latitudes of our star to turn once around. CIRs can cause space weather events near Earth and beyond.

Just like CMEs, CIRs that encounter Earth’s magnetic shield can trigger magnetic storms and aurora. In fact, CIRs cause more magnetic storms than do CMEs – CMEs create the strongest magnetic storms, but CIRs are more common.
Image credit: Marianne Bergli
How Do CIRs Form?
The outward motion of the solar wind and the Sun’s rotation combine to create a giant Archimedean spiral pattern, known as the Parker spiral. Both the shape of solar wind structures and the magnetic field in interplanetary space follow this spiral pattern.

![Diagram of Parker Spiral as suggested by Parker [1958] (Image credit: adapted from Kivelson, Russell (1996)).](./images/tiny/whatcir_parkerspiraldiag.png)
The spiral pattern is similar to that made by an old-fashioned rotating sprinkler or by a modern rotary fountain used in water show displays (see the video clip below). The water comes straight out of the nozzles with a particular speed as the nozzles are spun, and so the water stream forms a spiral shape as it flies out. In a similar way, the solar wind flows radially out of the solar corona as the Sun rotates, and individual streams of the solar wind form Archimedean spirals.


The Archimedean spiral is not the same as the logarithmic (or Golden) spiral that also occurs in Nature, for example in galaxies and hurricanes. Both types of spirals are abundant in the natural and human-designed world.


For Archimedean spirals like the solar wind, any ray from the center intercepts successive turnings of the spiral at points with a constant separation distance. For a logarithmic spiral, however, these distances grow larger with each successive turning of the spiral.
Each stream of solar wind leaving the Sun makes a slightly different Archimedean spiral. The pitch of the spiral (how far it moves outward for each rotation) depends on the speed that particular stream is flowing. Fast streams of solar wind travel farther during each rotation, and slow streams of solar wind travel less far. This Parker Spiral animation offers an interactive visualization of how the speed of solar wind outflow determines the shape of the solar wind spiral.

Image credit: UCLA Space Physics
The faster solar wind stream has a more open spiral arms, and the slower stream forms a tighter spiral. When a fast and slower solar wind stream are emerging from the corona next to one another, the different curvature of their Parker spirals can make the neighboring streams collide (or interact) as the faster stream overtakes the slower stream. When this occurs the material from the two streams piles up and makes a spiral whose pitch is intermediate between the original two spirals. This piled-up region is a CIR. The compressed material becomes more dense and hotter than the surrounding solar wind and can even form a persistent that sweeps around the Solar System once per month as the Sun rotates.

The interaction between the Parker spirals of neighboring faster and slower (here called “ambient”) solar wind streams produces a compression (or “piled-up”) region of enhanced density and temperature that co-rotates with the Sun. CIRs sweep through the heliosphere contributing to space weather near Earth and throughout the Solar System. Strong CIRs produce more space weather events at Earth than do CMEs – although CMEs produce the very strongest space weather.
Image credit: V. Pizzo
The diagram above was developed by PUNCH co-investigator Vic Pizzo more than 40 years ago. Since then CIRs have been studied by sampling the piled-up “wall” of material as it sweeps over space probes.
In 2011, the PUNCH Principal Investigator, Craig DeForest used STEREO mission data to demonstrate the feasibility of imaging the shape of a CIR as it sweeps over and past the Earth.
PUNCH will be able to image CIRs better and more routinely than any spacecraft before it, thereby helping to understand this enigmatic source of space weather at Earth.

A CIR is discernible in this highly processed time-lapse movie that makes use of data from a STEREO spacecraft. The Sun is located to the right of the frame. Earth is hidden behind a black cutout at left. From this perspective in space, the CIR looks like a bright, rounded “wall” or “arc” of material that moves from right to left. This CIR swept over Earth four times in a four-month period. This pioneering movie shows just one of these occasions.
Image credit: C. DeForest
PUNCH will be able to see shocks forming and evolving in the inner heliosphere with an unprecedented degree of detail. “Shocks”, in heliophysics, are moving, sudden, violent changes in the that can be caused by solar storms and other dynamic features such as . The strongest shocks are in front of fast-moving which plow through the surrounding solar wind as they cross interplanetary space.


Shocks appear in current spacecraft data as dense structures with very sharp leading edges. They sometimes lead to bursts of solar energetic particles (SEPs) that can endanger astronauts in space, interfere with communications, and cause showers of particle radiation in Earth’s atmosphere.
Image credit: adapted from Moses et al. 2015
Shocks can happen in any medium that carries wave motion, including air, water, and the solar wind plasma. Normal waves are a smooth, propagating change in the medium – like deep-water ocean waves that can cross thousands of miles and deliver energy across the sea. Shocks modify the medium suddenly, like a crashed “breaker” ocean wave arriving at the shore, dissipating its energy as sound and heat.

Shocks in the solar wind arise from two effects: 1) wave steepening like the ocean breaker that steepens and then crashes as a turbulent shock; and 2) rapid motion like the sonic boom around a supersonic jet.
This simple animation (below, left) illustrates how the V-shaped shock front (the sonic boom) is formed as a rapidly moving object meets and exceeds the sound speed (click to view entire duration of animation). When that shock sweeps over the ground, a person can hear a loud booming sound. The NASA image (below right) captures the first air-to-air images of supersonic shockwave interaction in flight.


Just as the air of Earth’s atmosphere can be shocked and heated by the passage of a rapidly moving jet or an explosion, the plasma of the solar wind can be shocked and heated by a rapidly moving Coronal Mass Ejection (CME). The resolution of PUNCH imagery will allow analysis of the shape of the leading edges of shocks as they form and change in the inner heliosphere.

This diagram shows results from computer simulations of a shock front triggered by a hypothetical CME. The Sun is a white ball at the far left. Earth is depicted by a yellow dot in each of the three simulations, with the lowest resolution in the leftmost frame, and the highest resolution in the rightmost frame. The high-resolution simulation reveals a shape instability at the leading edge of the shock, that may be related to how shocks dissipate energy and accelerate particles. PUNCH scientists seek to understand why some shocks produce a cascade of energetic particles and some do not.