Graphic 4b: 1994 Ground-based photograph of total solar eclipse during a time of solar minimum
Welcome to Tactile Graphic number 4b – the 1994 Ground-based Photograph! This is the fifth of seven images supporting the Petroglyph Inquiry.
Whether you are engaging fully with the Petroglyph Inquiry (recommended) or just browsing the PUNCH Outreach set of seven images in a random order, we strongly encourage you to begin by reading the 2-page section entitled Essential Background if you have not already done so.
Guided Description of the Tactile Graphic number 4b
Graphics 4a and 4b represent a pair of ground-based photographs, one at solar maximum and the other at solar minimum. Your task is to compare them. Please explore Graphic 4a if you have not already done so using the link in the navigation menu below.
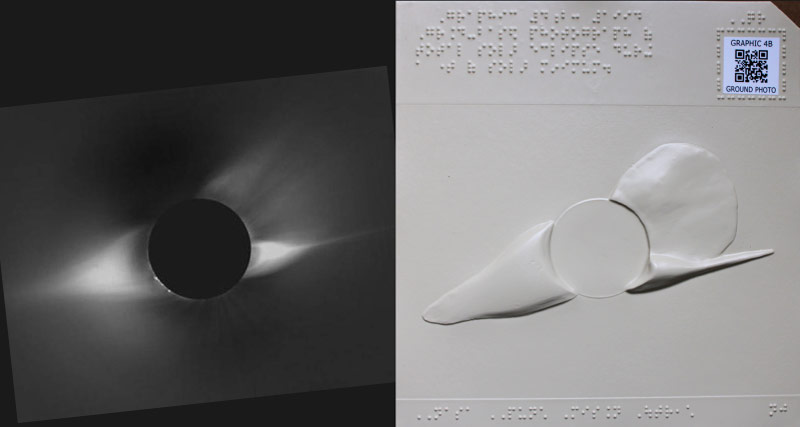
The tactile image between the Braille areas at the top and bottom of Graphic 4b represents a ground-based photograph of a total solar eclipse near a time of solar minimum when solar storms are less likely to occur. The photo was made by an expedition team from the High-Altitude Observatory – a world-renowned scientific research institution devoted to studying the Sun. The team observed and photographed the eclipse on November 3, 1994, from Putre, Chile in South America.
Please pause to explore the tactile image, be sure to find the features and address the question listed below:
- A central circular disk representing the Sun eclipsed by the Moon
- Coronal features extending out to the sides of the disk and not so much from the top and bottom
- Do you detect any curve or distortion that might represent the presence of a CME in this image?
Compare the ground-based photographs represented in Graphics 4a and 4b to notice the main difference between them. Notice that there are no curls or other distortions to indicate a solar storm or CME in either image.
Notice how the general shape of the overall corona during a solar maximum is different compared to the general shape of the coronal during a solar minimum. Of course, the corona is dynamic and constantly changing, however there is generalized difference to be noticed when comparing coronal structure at solar maximum and minimum.
When the coronal rays are extending out in most all directions, is this during a solar maximum or a solar minimum? When the coronal structures are extending more out to the sides and not so much from the top and bottom of the disk, is this during a solar maximum or a solar minimum? Do your best to remember which is which.
REFLECTION and DISCUSSION
How can the difference between the structure of the solar corona at solar minimum and solar maximum be used to help interpret the Chaco petroglyph? If the “eclipse hypothesis” is correct, would you say the petroglyph is depicting the solar corona at a time of solar minimum or solar maximum? Why?
Graphics 4a and 4b: ADDITIONAL COMMENTARY for those doing the PETROGLYPH INQUIRY
The two comments below are intended to enrich and support your participation in the “petroglyph inquiry.” As you read them, please keep going with your list of strengths, weaknesses, ideas, and questions regarding the “1097 eclipse” hypothesis for interpreting the Chaco petroglyph (Graphic 1).
How can the difference between the structure of the solar corona at solar minimum and solar maximum be used to help interpret the Chaco petroglyph? Here are some points to consider:
- Even though the ancient petroglyph design has curlicue features rather than rays, those features are included in most every direction around the central disk. This is more consistent with a coronal structure at a solar maximum.
- Independent research suggests that 1097 was near a period of solar maximum on the Sun. This makes a solar storm more probable during the few minutes of totality, but even when the corona is seen during solar maximum there does not have to a solar storm in progress at that moment. The eclipse photograph represented in Graphic 4a was made near a time of solar maximum, but the corona shows no sign of a CME.
REFLECTION
What do you think? Please consider the commentary above as you add to your list of strengths, weaknesses, ideas, and questions regarding the “1097 eclipse” hypothesis for interpreting the Chaco petroglyph (Graphic 1).
When you are ready, click the NEXT button to go to graphics 5a and 5b, which are spacecraft images of the solar corona, one at solar minimum, and the other at solar maximum.