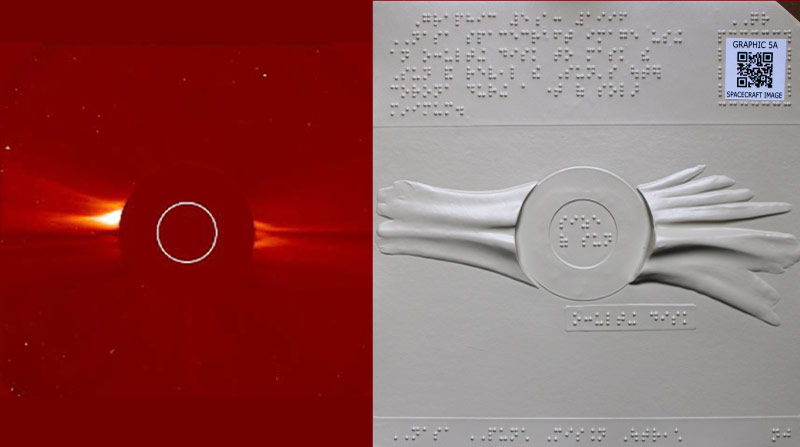
Graphic 5a: 1996 NASA spacecraft image using an occulting disk to mask the Sun and reveal its outer corona during a time of solar minimum
Welcome to Tactile Graphic number 5a – the 1996 Spacecraft Image! This is the sixth of seven images supporting the Petroglyph Inquiry.
Whether you are engaging fully with the Petroglyph Inquiry (recommended) or just browsing the PUNCH Outreach set of seven images in a random order, we strongly encourage you to begin by reading the 2-page section entitled Essential Background if you have not already done so.
Guided Description of the Tactile Graphic number 5a

Graphics 5a and 5b represent a pair of spacecraft images, one at solar minimum and one at solar maximum. Your task is to compare them.
The tactile image between the Braille areas at the top and bottom of Graphic 5a represents a NASA spacecraft image of the solar corona made in 1996 near a time of solar minimum.
The inner recessed ring represents the scaled size of the Sun. The outer ring represents the field of view blocked by an occulting disk that is part of an instrument aboard the spacecraft called a coronagraph. A coronagraph blocks the light of the Sun to allow us to observe the corona at any time, not just during natural eclipses on Earth.
The NASA spacecraft carrying the coronagraph is called the Solar and Heliospheric Observatory, or SOHO for short. To make the most detailed images of the outer corona, the occulting disk of the SOHO coronagraph must also block the light a bit farther out from the solar disk. This means we cannot observe the inner corona. But during a natural total eclipse of the Sun the inner corona remains visible and so ground-based eclipse observations remain an important and complementary way to study the Sun.
Please pause to explore the tactile image carefully, be sure to find the features and address the questions listed below:
- The inner recessed ring representing the scaled size of the Sun
- The outer ring representing the field of view blocked by the coronagraph’s occulting disk
- Are coronal features extending out from most directions around of the central disk?
- Do you detect any curve or distortion that might represent the presence of a CME in this image? Where?
When you are ready, click the NEXT button to go to graphic 5b, which represents a NASA spacecraft image of the solar corona made near a time of solar maximum.
Your task is to compare the images in Graphic 5a and 5b to notice the differences between them.
